
The 2026 Teaching Quality Survey took place in the middle of changes at the university and in politics, many of which affect both student well-being and their ability to study. The LTKY’s OLS survey mapped LUT students’ views on well-being, community, studies, the use of artificial intelligence, services, and employment. The open-ended responses revealed students’ concerns about whether they are actually listened to or involved in the development of their education. Analysis of the responses has shown how diverse the needs, challenges, and aspirations are across different fields and student groups.
Well-being
Unfortunately, the increasing amount of mental health issues is not a surprise. The FSHS reports a rise in mental health-related inquiries, and the Youth Barometer indicates that young people’s confidence in the future and sense of security are declining (FSHS 2026, Laine & Happonen 2026). At LUT, 32% of students reported being worried about their mental health often or all the time. In 2025, the number was 25%. The most common factors undermining overall well-being were mental health problems, sleep problems, and financial worries.
Has the following factor diminished your well-being? (Affirmative answers) | ||||||
Finnish students | International students | |||||
2024 | 2025 | 2026 | 2024 | 2025 | 2026 | |
Issues with mental health | 27 % | 29 % | 33 % | 47 % | 41 % | 60 % |
Issues with sleep | 30 % | 32 % | 32 % | 47 % | 42 % | 53 % |
Worries related to money | 29 % | 31 % | 34 % | 59 % | 50 % | 62 % |
Table 1 – Most common factors diminishing well-being during 2024 – 2025, nationality comparison
There are significant and truly concerning differences in well-being between international and Finnish students. International students face more challenges in nearly all areas of well-being. Access to adequate nutrition, which was measured for the first time this year, also affected international students more than Finnish students. As the student body becomes more diverse, the need for different services and support must be taken into account locally and nationally.
The perceived workload varies significantly depending on the field of study and the stage of studies. In the first year, there is no difference in the perceived workload between Finnish and international students (Finnish avg. 3.3, international avg. 3.3), but in the second year, international students feel slightly more burdened (Finnish avg. 3.5, international avg. 3.7). Among first-year bachelor’s students, those studying computational engineering, software engineering and environmental engineering are more stressed than others.
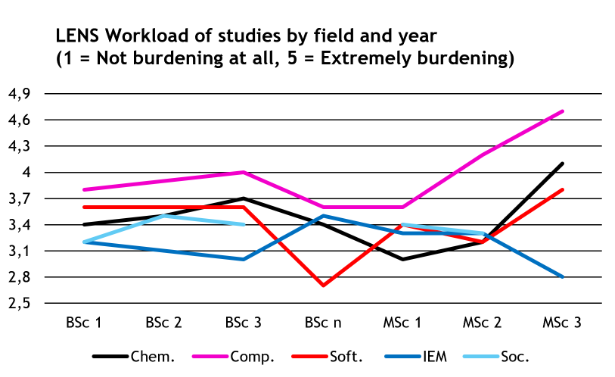
Graph 1 – LENS Workload of studies by field and year
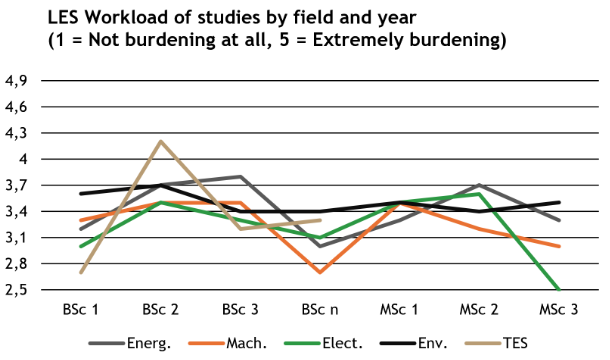
Graph 2 – LES Workload of studies by field and year
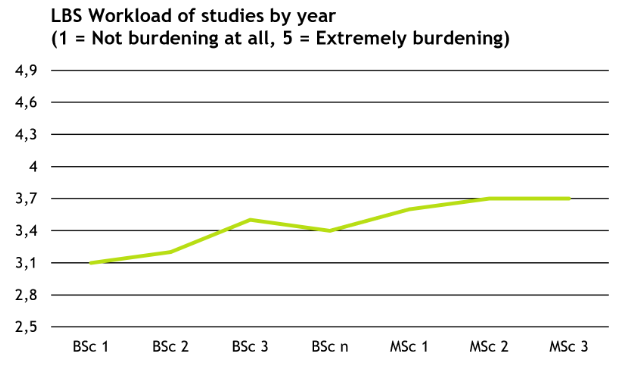
Graph 3 – LBS Workload of studies by year
Mental health challenges are seen to correlate with many other challenges. Students who are frequently or constantly concerned about their mental health often rate their pace of study as slower than average, and 42% have considered dropping out or changing their field of study. 41% of them feel they do not have enough free time, and 58% feel that academic pressures affect the rest of their lives. All of these figures are significantly higher than the LUT average. Students concerned about their mental health experience loneliness or inappropriate treatment more often than the average. In open-ended responses, they mention, for example, a desire for flexibility in their studies, easily accessible academic support, and events where it is easy and stress-free to get to know others.
Teaching
Compared to last year, students reported slightly more difficulties with their studies. This is reflected in their evaluations of the quality of teaching, as well as in the fact that fewer students believe they will graduate on time.
Evaluate the realization of the following factors related to studies at LUT. | |||
(1 = Very poor, 5 = Excellent) | |||
2024 | 2025 | 2026 | |
The quality of lectures | 3.5 | 3.5 | 3.3 |
Exam grades reflect competence | 3.5 | 3.5 | 3.4 |
Course evaluations reflect competence | 3.6 | 3.6 | 3.4 |
Getting help in exercise groups | 3.7 | 3.8 | 3.6 |
Interaction with the course teachers | 3.4 | 3.5 | 3.3 |
Table 2 – Changes in evaluations of teaching in LUT 2024 – 2026
Experiences with study groups and the support received vary by campus and between Finnish and international students. On a scale of 1 to 5, where 5 is the highest rating, “Receiving help in study groups” received a rating of 4.1 from Finnish students. The average rating given by international students was 3.5. A difference was also observed between Lappeenranta and Lahti: the average rating given by students in Lappeenranta was 4.1, while that of students in Lahti was 3.6.
Opinions on distance and in-person learning vary by field of study. In general, hybrid learning is the most popular teaching method, and 56% of students feel they benefit from it. When comparing fields of study, it is evident that business students in particular feel they benefit from distance learning (business students 63%, engineering students 45%, social science students 45%). Social science students benefited the most from in-person teaching (social science students 57%, engineering students 50%, business students 33%). However, it is not meaningful to group all technical fields together when comparing teaching methods, as the results vary significantly by field. In the technical fields, in-person instruction was preferred over distance learning in chemical engineering, computational engineering, mechanical engineering, and the TES program. Distance learning was preferred in software engineering and industrial engineering and management. There was no clear preference in energy, electrical, and environmental engineering. There are also differences in preferences between bachelor’s and master’s students, as well as between Finnish and international students.
Have the following factors affected the progress of your studies? | ||
(1 = Major negative influence, 5 = Major positive influence) | ||
Experiences a negative influence | Experiences a positive influence | |
On-campus learning (ka. 3.3) | 25 % | 48 % |
Distance learning (ka. 3.3) | 28 % | 48 % |
Hybrid learning (ka. 3.5) | 18 % | 56 % |
Table 3 – Effects of teaching methods, all students
Have the following factors affected the progress of your studies? | ||||
(1 = Major negative influence, 5 = Major positive influence) | ||||
Bachelor’s students | Master’s students | Finnish students | International students | |
On-campus learning | 3.5 | 3.1 | 3.2 | 3.6 |
Distance learning | 3.2 | 3.5 | 3.4 | 3.1 |
Hybrid learning | 3.6 | 3.5 | 3.5 | 3.6 |
Table 4 – Effects of teaching methods, comparisons
In the open-ended question about issues in education, group work was highlighted in particular. There are many problems. Group work often takes time away from actual learning and delving into the subject matter, as time and energy are spent on coordinating the group. Especially in groups that are random or predetermined, there is a problem with free-riders and the fact that students contribute different amounts of effort to the work. When multiple concurrent courses involve group work, coordination and scheduling one’s own studies become even more difficult. In their responses, students recognize the importance of group work skills but feel that current group work assignments do not develop these skills.
This year, for the first time, the survey included a section on students’ use of artificial intelligence, which revealed that 96% of students use artificial intelligence in one way or another in their studies. The most common purpose of usage was understanding topics and learning, which is also reflected in the open-ended responses: several students reported that AI complements or, in some cases, replaces the instruction provided by teachers. Other common uses included searching for information, planning, and checking grammar. The most common reasons for using AI were to support one’s own thinking, save time, and simply because using AI is convenient and easy. Understandably, purposes of usage vary by field due to differing course assignments, but differences can also be observed in the reasons of usage. In some fields, the need to compensate for inadequate teaching materials is emphasized, while in others, the difficulty of the assignments is highlighted.
The results can help us understand what needs to be taken into account in decision-making and in the development of LUT. Sara, Henna, and Vera from LTKY’s advocacy sector have presented the survey results to students, professors, the language center, study psychologists, and the directors of degree programs and schools. Data on well-being was presented to Annika Saarikko and other FSHS leadership, and responses regarding artificial intelligence were shared with the educational technology team. LTKY also utilizes the results in the bachelor’s degree reassessment and in all day-to-day advocacy work.
LTKY thanks all who responded to the survey!
Sources
FSHS. 2026. Vuosikatsaus 2025. Cited 3.6.2026. Available: https://www.yths.fi/vuosikatsaus-2025/
Laine, S. & Happonen, K. (ed.) 2026. Ihan paineissa. Nuorisobarometri 2025. Cited 3.6.2026. Available: https://edition.fi/nuorisotutkimusseura/catalog/view/1883/2143/7696